sciencegcse← P3 lessons

Physics Paper 1 · P3 · Lesson 3.9

Heating and cooling graphs

Read the slopes and flat sections one step at a time.

Key ideas1 of 4

Read a heating graph

On a sloping section, temperature rises. On a flat section, a change of state happens at constant temperature. This graph shows a pure sample heated at constant pressure.
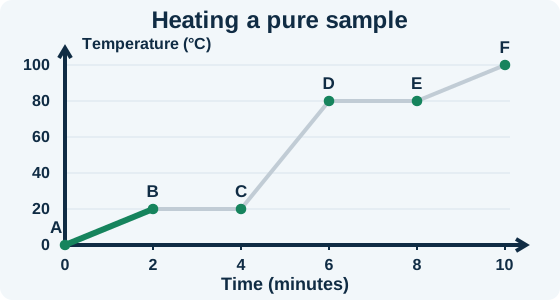
Heating graph with section A–B warming solid highlighted.

The sample has a melting point of 20°C and a boiling point of 80°C.

Next: Gas temperature and pressure →
Topic resources and sources

Daily 5 · Exam practice · A4 revision sheet

All P3 content here is shared by Foundation and Higher Tier. Stretch questions combine the core ideas; they are not additional Higher Tier-only content.

AQA Combined Science Trilogy specification · 6.3.2.3. Original notes, questions and diagrams. Particle diagrams are simplified; animation speeds and experimental numbers are illustrative.

Photographs: Melt by Kathy Jantz, CC BY 4.0; Menisco 18mL-2 by Leandro Maranghetti Lourenço, CC BY-SA 3.0 (chosen from the licences offered); Bicycle Pump foot operated by Scott Ehardt (SCEhardt), Public domain, released worldwide by copyright holder. Images displayed without cropping or alteration; a resized source image is used for the ice.