sciencegcse← Topic extras

Separate Biology · Paper 2 · Foundation + Higher · B7

RP10: interpreting decay data

Key ideas1 of 3

Read change over equal intervals

The illustrative table follows the alkaline milk and lipase model for 180 seconds. All samples start at pH 9.0, so their final readings can be compared alongside their changes. The largest fall occurs at thirty degrees Celsius in this example. This supports faster acid production within the tested range. It does not prove that higher temperatures always give faster reactions, or that the model measures the number of microorganisms.
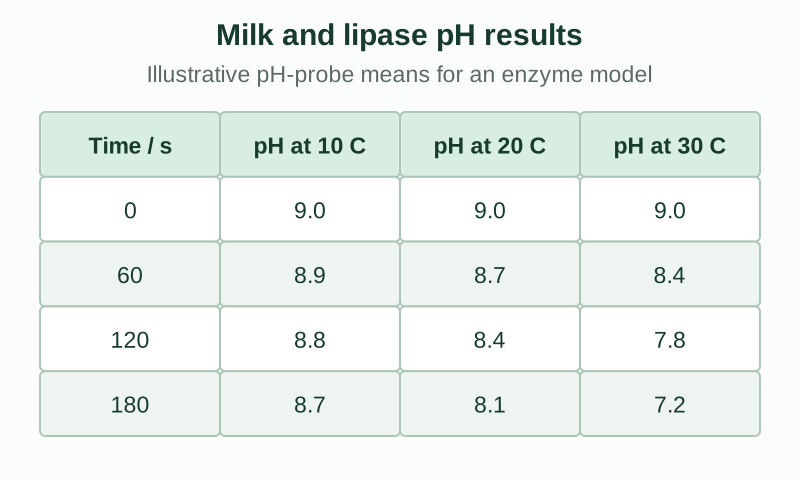
Illustrative lipase-model pH table. At 0, 60, 120 and 180 seconds: 10 C readings 9.0, 8.9, 8.8, 8.7; 20 C readings 9.0, 8.7, 8.4, 8.1; 30 C readings 9.0, 8.4, 7.8, 7.2.

Next: Trophic levels and decomposers →
Practice, downloads and sources

Daily 5 · Exam practice · Revision sheet ↓

Foundation + Higher · B7. Use alongside the shared B7 lessons.

AQA GCSE Biology 8461 · 4.7.2.3 / RP10. Original notes, questions and diagrams. Models are simplified; teaching data are illustrative.