Key ideas1 of 3
Read the quantity on each graph
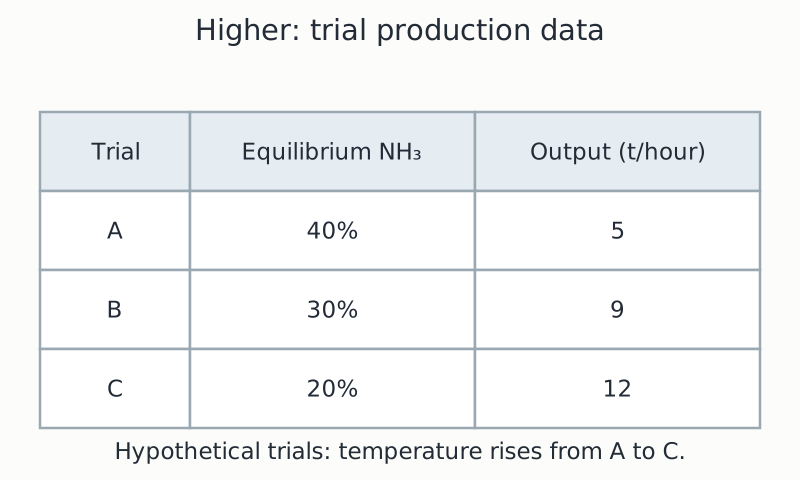
A graph of equilibrium percentage tells you composition after equilibrium has been reached; it does not directly give tonnes produced per hour. A rate graph describes how quickly material is formed or converted. Increasing temperature can raise rate while lowering equilibrium ammonia yield. Compare curves only at the stated pressure, temperature or catalyst conditions. A higher yield per pass is useful, but it is not the sole measure of factory performance.