Key ideas1 of 3
Read a cooling curve
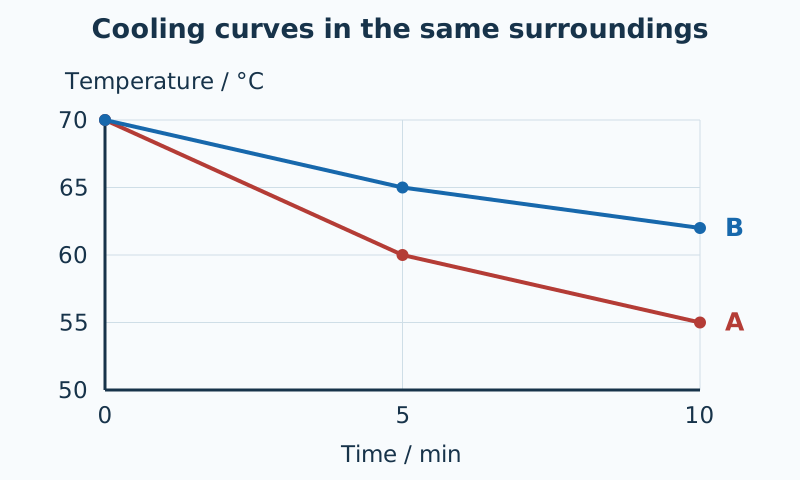
Plot temperature on the vertical axis and elapsed time on the horizontal axis. Choose labelled axes with units and an even scale. A curve with a smaller fall over the same interval indicates slower cooling when the starting conditions match. The gradient gives the rate of temperature change. Cooling often becomes slower as the water temperature approaches the temperature of its surroundings.