sciencegcse← Topic extras

Separate Physics · Paper 2 · Foundation + Higher · P5

Estimating and comparing stopping distances

Key ideas1 of 3

Make an estimate from a graph

Stopping distance includes thinking distance and braking distance. A speed–stopping-distance graph allows estimates over the shown speed range. Start at the speed on the horizontal axis, move vertically to the chosen vehicle’s curve, then across to read distance. Use the scales, not the curve’s visual height alone. The two curves here represent illustrative vehicles under stated, unchanged test conditions.
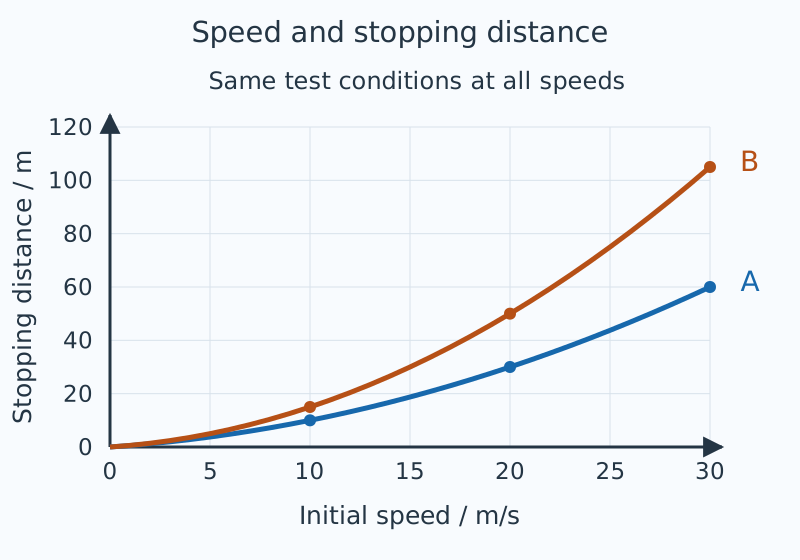
Curves A and B on common axes from 0–30 m/s and 0–120 m, under fixed illustrative test conditions.

Try exam practice →
Practice, downloads and sources

Daily 5 · Exam practice · Revision sheet ↓

Foundation + Higher · P5. Use alongside the shared P5 lessons.

AQA GCSE Physics 8463 · 4.5.6.3.1. Original notes, questions and diagrams. Models are simplified; teaching data are illustrative.