Key ideas1 of 3
Read the journey
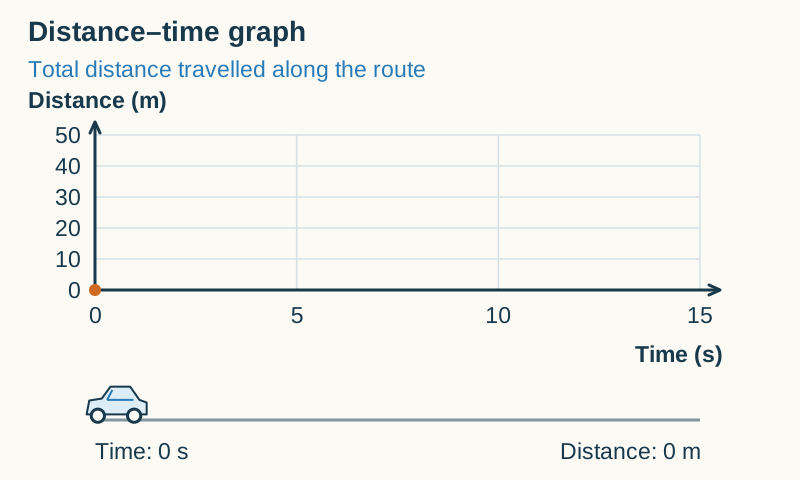
A distance–time graph shows distance on the vertical axis and time on the horizontal axis. A rising line means that distance is increasing. A horizontal line means the object is stationary. A straight rising line shows constant speed; a steeper line means a greater speed. In this example, section A rises from 0 m to 20 m in 5 s, section B remains at 20 m, and section C reaches 50 m. The animation follows these three sections.