sciencegcse← P5 overview

Physics · Paper 2 · Foundation + Higher · P5

Velocity–time graphs

Key ideas1 of 3

Read velocity at a time

A velocity–time graph shows velocity vertically and time horizontally. A horizontal line means constant velocity; a line on zero velocity means the object is stationary. A rising straight line shows constant positive acceleration. In this example, velocity rises from 0 to 8 m/s during the first 4 s, stays at 8 m/s from 4 s to 8 s, then returns to zero at 12 s. All shown velocities are zero or positive.
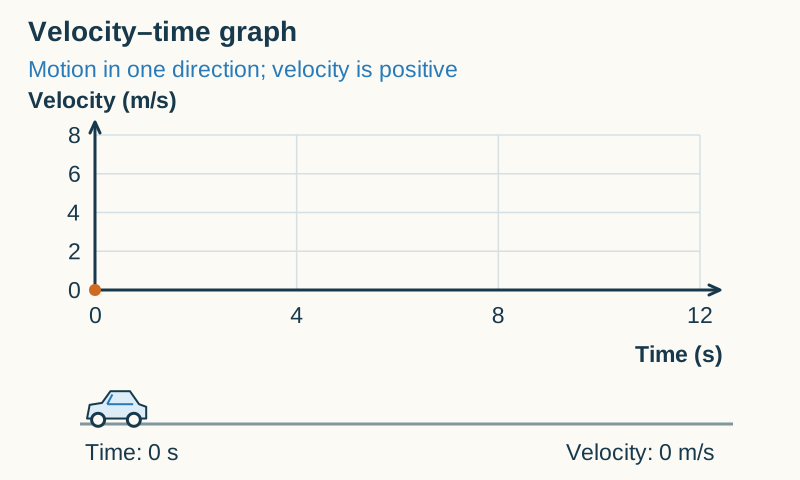
Start from rest.

Next: Uniform acceleration calculations →
Practice, downloads and sources

Daily 5 · Exam practice · Revision sheet ↓

Foundation + Higher · P5. Twenty core lessons, followed by five labelled Higher Tier lessons.

AQA Combined Science Trilogy 8464 · 6.5.4.1.5. Original notes, questions and diagrams. Models are simplified; teaching data are illustrative.