sciencegcse← Topic extras

Separate Physics · Paper 2 · Foundation + Higher · P5

Interpreting terminal-velocity graphs

Key ideas1 of 3

Link a curve to changing forces

Take downward velocity as positive. A falling object starts with a steep upward slope on its velocity–time graph: its downward velocity is increasing rapidly. As it speeds up, drag increases while its weight stays approximately constant. The downward resultant force becomes smaller, so acceleration falls. The graph keeps rising but becomes less steep. In this air-resistance model, upthrust is negligible.
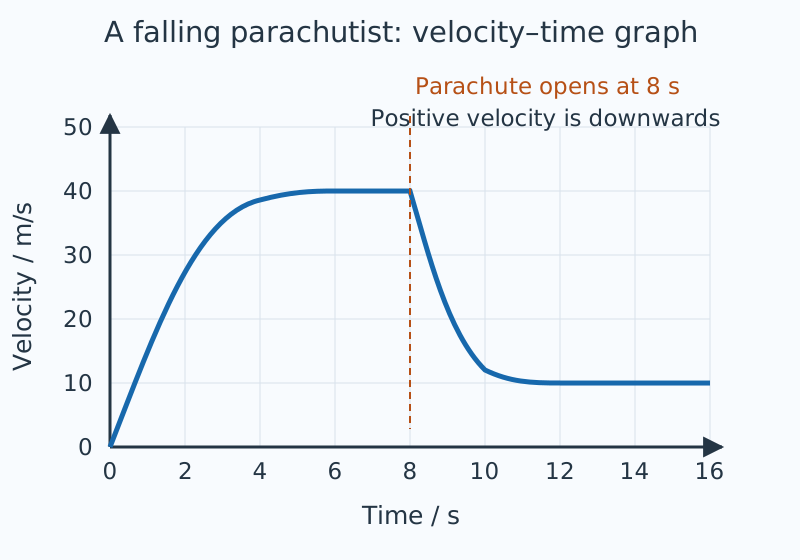
Graph with time 0–16 s and downward velocity 0–50 m/s; a first plateau, a fall after parachute opening at 8 s, then a lower plateau.

Next: Estimating and comparing stopping distances →
Practice, downloads and sources

Daily 5 · Exam practice · Revision sheet ↓

Foundation + Higher · P5. Use alongside the shared P5 lessons.

AQA GCSE Physics 8463 · 4.5.6.1.5. Original notes, questions and diagrams. Models are simplified; teaching data are illustrative.